According to the full year import statistics for 2013, Italy’s plastics market saw positive growth last year following two straight years of contraction as per ChemOrbis. However, the trend varied significantly amongst products, with several still contracting and others booming. PET clearly contributed positively with import growth of 32% year over year, while PS saw the fastest rate of contraction at negative 9%. HDPE and LDPE imports grew, but LDPE continued to lag behind the other PE products.

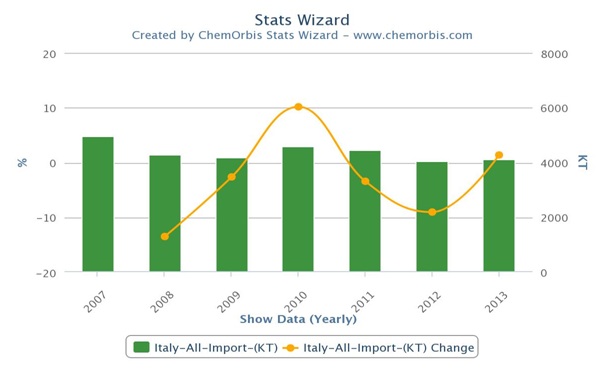
According to the full year import statistics for 2013, Italy’s plastics market saw positive growth last year following two straight years of contraction. Italy’s imports of plastic raw materials were up 1% in 2013. This follows a contraction of 9% the previous year and a contraction of 3% in 2011. There was positive growth in 2010 of 10%, but this came after two years of a contraction when the market saw imports fall 14% in 2008 and then another 3% in 2009.
Total imports for the commodity plastics in 2013 reached 4,083,000 tons. This is an improvement from the prior year, but down a significant 652,000 tons from the peak in 2007.
One of the products contributing to the upward movement in Italy’s overall import growth was PET. Imports of PET grew at a whopping pace of 32% year over year in 2013. This was the fastest pace of growth amongst all of the commodity plastics. While total import volume has not recovered to the level seen in 2009, the growth was positive, reaching 269,000 tons in 2013. This made 2013 the highest import volume since the year 2009 when total volume was at 336,000 tons.

In contrast, PS imports fell 9% last year compared to 2012. It showed the worst performance year over year in terms of volume growth rate in 2013 amongst the commodity plastics. The decline in PS imports and the recovery in the PET market, caused the total import value for PET in millions of USD to surpass that of the PS market last year. This was seen only once before in the year 2009.
*ChemOrbis members can create their own import graphics using available import data including total volumes, total value, and value per metric ton and by comparing across regions, across products and time periods. Visit the new Stats Wizard found under the Analysis Tools to run your own graphs. Members can click here: Stats Wizard
In the PE market, both HDPE and LDPE imports saw positive growth rates in 2013. LDPE imports were up 4% from the previous year and HDPE grew 1%. Overall LLDPE imports, however, are clearly depressed relative to the past years. Looking at total volume of LLDPE imports, it’s clear that there has been a declining trend for several years, since the peak in 2007 at 412,000 tons. In 2013, Italy imported 223,000 tons of LLDPE. Apart from the slight upward bounce in the year 2010, LLDPE imports have been declining year over year since 2007.
According to ChemOrbis, imports of HDPE continued to outpace both LDPE and LLDPE in terms of overall volume. Imports of HDPE were up 1% in 2013 year over year, reaching a total of 643,000 tons. LDPE also saw a positive growth rate of 4% last year, reaching a total volume of 508,000 tons.


