Global demand to rise 6% annually through 2015
Global demand for plastics processing machinery is projected to rise 6.0 percent yearly through 2015 to $28.7 billion, an improvement over market growth during the recession-impacted 2005-2010 period. Sales growth will be driven by an acceleration in plastic manufacturing output and by a favorable fixed investment environment worldwide. In addition, rising income levels, especially in developing nations, will spur demand for both plastic products and plastic packaging.
Extrusion equipment to exhibit most rapid gains
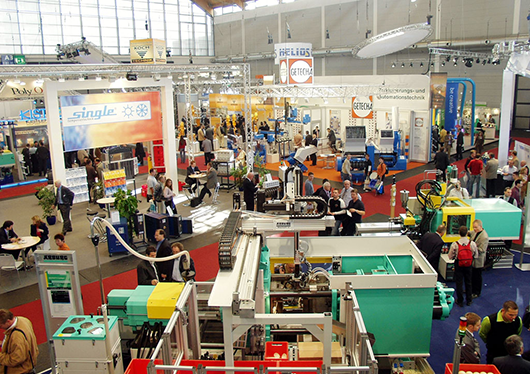
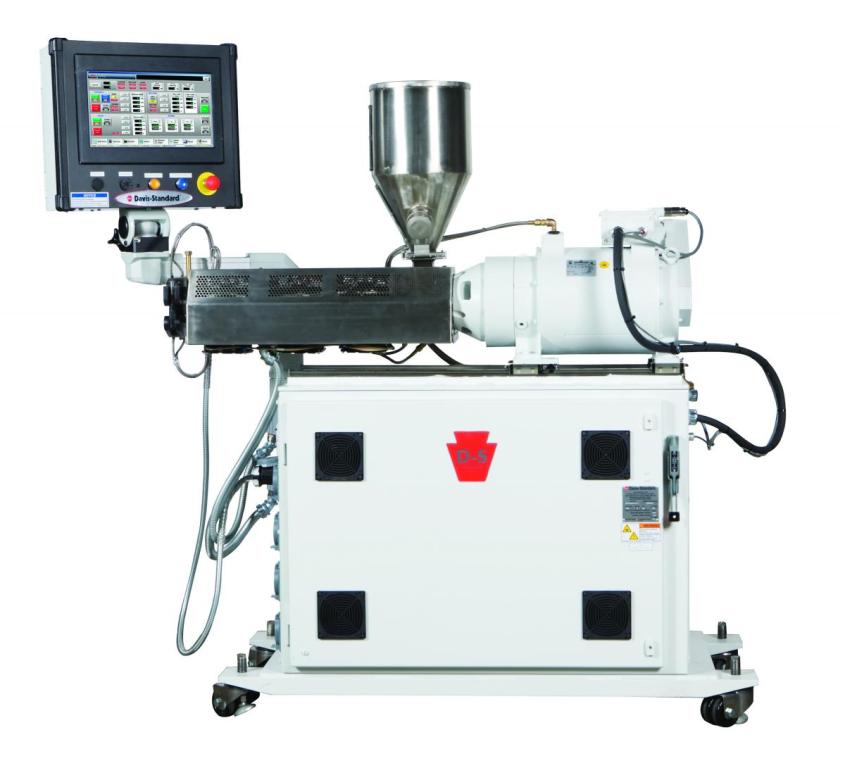
Among product types, extrusion equipment will register the most rapid gains through 2015, benefiting from growth in global construction spending, which will fuel demand for extruded goods like pipe and siding. Injection molding equipment will remain the largest product segment, accounting for 40 percent of demand in 2015. Injection molding machines are used in a variety of applications, ranging from automotive components to consumer goods to medical supplies.
Construction, consumer/ institutional markets to register strongest gains
The construction market will exhibit the strongest gains through 2015, benefiting from an acceleration in global construction spending. The consumer/institutional products market will also post aboveaverage gains, reflecting rising standards of living. The packaging market will post respectable gains due to rising manufacturing output and consumer demand for packaged products.
Developing nations to spur global market advances
Gains in developing nations will be the driving force behind advances in the global market for plastics processing equipment. China, for example, will account for more than 40 percent of all additional demand through 2015, with growth stimulated by strong increases in plastic manufacturing as industrialization efforts continue and income levels rise. Other nations in Asia with smaller, lessdeveloped economies, such as India, Vietnam and Thailand, will also record healthy market gains. In developed areas of the world, most notably Western Europe, the US and Japan, demand will rebound after a period of decline, although sales advances will not be as strong as those in developing nations.
Study coverage
This upcoming industry study presents historical demand data through 2010 plus forecasts for 2015 and 2020 by product and primary application for six world regions and 30 countries. The study also details market environment factors, evaluates company market share and profiles global players such as Engel, Haitian International, Husky Injection Molding Systems, Japan Steel Works, KraussMaffei Technologies, Milacron, and Sumitomo Heavy Industries.
TABLE OF CONTENTS INTRODUCTION xiiI. EXECUTIVE SUMMARY 1 II. MARKET ENVIRONMENT 4
General 4World Population Outlook 5World Economic Overview 7World Economic Performance 7World Economic Outlook 9World Fixed Investment Outlook 13World Construction Expenditures Outlook 15World Personal Consumption Expenditures 17World Packaging Industry Outlook 19World Plastics Industry Outlook 23Pricing Patterns 27Technology Trends 30Rebuilt & Remanufactured Machinery 31Legal & Regulatory Environment 33
III. OVERVIEW 36
General 36Regional Overview 37Demand 37Production 41International Trade 44Demand by Product 46Injection Molding Machinery 49Extrusion Machinery 51Blow Molding Machinery 54Thermoforming & Other Machinery 56Thermoforming Machinery 60Other Machinery 61Plastics Machinery Aftermarket Parts 61Demand by Primary Application 64Packaging 66Consumer/Institutional Products 68Construction 70Other 72
IV. NORTH AMERICA 75
North America 75Supply & Demand 76Outlook & Suppliers 78United States 80Canada 87Mexico 91
V. WESTERN EUROPE 98
Western Europe 98Supply & Demand 99Outlook & Suppliers 101Germany 103Italy 108France 113Spain 118United Kingdom 123Belgium 128Austria 132Other Western Europe 137Other Supply & Demand by Country 142Switzerland 143Netherlands 144All Other Western Europe 145
VI. ASIA/PACIFIC 146
Asia/Pacific 146Supply & Demand 147Outlook & Suppliers 150China 152Japan 159India 165Thailand 171South Korea 175Indonesia 180Taiwan 185Malaysia 190Vietnam 195Other Asia/Pacific 200Other Supply & Demand by Country 205Australia 206All Other Asia/Pacific 207
VII. OTHER REGIONS 208
Central & South America 208Supply & Demand 209Outlook & Suppliers 211Brazil 212Other Central & South America 217Eastern Europe 222Supply & Demand 224Outlook & Suppliers 225Russia 227Poland 232Czech Republic 237Other Eastern Europe 242Africa/Mideast 247Supply & Demand 249Outlook & Suppliers 250Turkey 252Iran 257Other Africa/Mideast 262South Africa 268Saudi Arabia 269All Other Africa/Mideast 270
VIII. INDUSTRY STRUCTURE 271
General 271Industry Composition 272Market Share 275Product Development & Manufacturing 279Marketing & Distribution 281Cooperative Agreements 284Financial Requirements 288Mergers & Acquisitions 289Company Profiles 293ARBURG GmbH & Company KG 294BC Extrusion Holding GmbH 296BEKUM Maschinenfabriken GmbH 298Brückner Group 300Cannon Group 303Chen Hsong Holdings Limited 307Coperion Holding GmbH 310Cosmos Machinery Enterprises Limited 312Dalian Rubber and Plastics Machinery Company Limited 315Dalian Sunlight Machinery Company Limited 316Davis-Standard LLC 317DME, see MilacronDongshin Hydraulics Company Limited 319Engel Holding GmbH 321FANUC Corporation 325Fu Chun Shin Machinery Manufacture Company Limited 326Gloucester Engineering Company Incorporated 328Haitian International Holdings Limited 330Hennecke GmbH 332Husky Injection Molding Systems Limited 334Industrias Romi SA 337Japan Steel Works Limited 339Kautex Maschinenbau GmbH 341KHS, see SalzgitterKiefel, see Brückner GroupKlöckner-Werke, see SalzgitterKraussMaffei Technologies GmbH 344Krones AG 348KTW Austria, see Husky Injection Molding SystemsLeistritz AG 351Macchi SpA 353Meiki Company Limited 354Milacron LLC 356Mitsubishi Heavy Industries Limited 359Negri Bossi, see Sacmi ImolaNetstal-Maschinen, see KraussMaffei TechnologiesNiigata Machine Techno Company Limited 361Ningbo Haixing Plastic Machinery ManufacturingCompany Limited 362Nissei ASB Machine Company Limited 363Nissei Plastic Industrial Company Limited 365OiMA, see Sacmi ImolaPackSys Global, see Brückner GroupReifenhäuser GmbH & Company KG Maschinenfabrik 367Sacmi Imola SC 370Salzgitter AG 373Shanghai Jwell Machinery Company Limited 375SHI Plastics Machinery, see Sumitomo Heavy IndustriesSidel, see Tetra Laval InternationalSIPA, see Zoppas IndustriesSumitomo Heavy Industries Limited 378Tetra Laval International SA 381Toshiba Machine Company Limited 383Toyo Machinery & Metal Company Limited 385Uniloy, see MilacronWittmann Battenfeld GmbH 387Woojin Selex Company Limited 390Zoppas Industries SpA 391
LIST OF TABLES
SECTION I — EXECUTIVE SUMMARY Summary Table 3SECTION II — MARKET ENVIRONMENT 1 World Population by Region 6
2 World Gross Domestic Product by Region 13
3 World Fixed Investment by Region 15
4 World Construction Expenditures by Region 17
5 World Personal Consumption Expenditures by Region 19
6 World Packaging Demand by Region 23
7 World Plastic Resin Demand by Region 26
SECTION III — OVERVIEW 1 World Plastics Processing Machinery Demand by Region 40
2 Plastics Processing Machinery Shipments by Region 43
3 Plastics Processing Machinery Net Exports by Region 46
4 World Plastics Processing Machinery Demand by Product 48
5 World Injection Molding Machinery Demand by Region 51
6 World Extrusion Machinery Demand by Region 53
7 World Blow Molding Machinery Demand by Region 56
8 World Thermoforming & Other Plastics Processing Machinery
Demand by Region & Product 60
9 World Plastics Processing Machinery Aftermarket Parts
Demand by Region 64
10 World Plastics Processing Machinery Demand by Primary
Application 65
11 World Plastics Processing Machinery Demand by Region:
Primary Application – Packaging 68
12 World Plastics Processing Machinery Demand by Region:
Primary Application – Consumer/Institutional Products 70
13 World Plastics Processing Machinery Demand by Region:
Primary Application – Construction 72
14 World Plastics Processing Machinery Demand by Region:
Primary Application – Other 74
SECTION IV — NORTH AMERICA 1 North America: Plastics Processing Machinery Supply
& Demand 77
2 North America: Plastics Processing Machinery Demand
by Product & Primary Application 80
3 United States: Plastics Processing Machinery Supply
& Demand 84
4 United States: Plastics Processing Machinery Demand
by Product & Primary Application 86
5 Canada: Plastics Processing Machinery Supply & Demand 89
6 Canada: Plastics Processing Machinery Demand by Product
& Primary Application 91
7 Mexico: Plastics Processing Machinery Supply & Demand 94
8 Mexico: Plastics Processing Machinery Demand by Product
& Primary Application 97
SECTION V — WESTERN EUROPE 1 Western Europe: Plastics Processing Machinery Supply
& Demand 100
2 Western Europe: Plastics Processing Machinery Demand
by Product & Primary Application 103
3 Germany: Plastics Processing Machinery Supply & Demand 106
4 Germany: Plastics Processing Machinery Demand
by Product & Primary Application 108
5 Italy: Plastics Processing Machinery Supply & Demand 111
6 Italy: Plastics Processing Machinery Demand by Product
& Primary Application 113
7 France: Plastics Processing Machinery Supply & Demand 116
8 France: Plastics Processing Machinery Demand by Product
& Primary Application 118
9 Spain: Plastics Processing Machinery Supply & Demand 121
10 Spain: Plastics Processing Machinery Demand by Product
& Primary Application 123
11 United Kingdom: Plastics Processing Machinery Supply
& Demand 126
12 United Kingdom: Plastics Processing Machinery Demand
by Product & Primary Application 128
13 Belgium: Plastics Processing Machinery Supply & Demand 130
14 Belgium: Plastics Processing Machinery Demand by Product
& Primary Application 132
15 Austria: Plastics Processing Machinery Supply & Demand 135
16 Austria: Plastics Processing Machinery Demand by Product
& Primary Application 137
17 Other Western Europe: Plastics Processing Machinery Supply
& Demand 140
18 Other Western Europe: Plastics Processing Machinery Demand
by Product & Primary Application 142
19 Other Western Europe: Plastics Processing Machinery Supply
& Demand by Country 143
SECTION VI — ASIA/PACIFIC 1 Asia/Pacific: Plastics Processing Machinery Supply
& Demand 149
2 Asia/Pacific: Plastics Processing Machinery Demand
by Product & Primary Application 152
3 China: Plastics Processing Machinery Supply & Demand 156
4 China: Plastics Processing Machinery Demand by Product
& Primary Application 159
5 Japan: Plastics Processing Machinery Supply & Demand 163
6 Japan: Plastics Processing Machinery Demand by Product
& Primary Application 165
7 India: Plastic Processing Machinery Supply & Demand 168
8 India: Plastics Processing Machinery Demand by Product
& Primary Application 170
9 Thailand: Plastics Processing Machinery Supply & Demand 173
10 Thailand: Plastics Processing Machinery Demand by Product
& Primary Application 175
11 South Korea: Plastics Processing Machinery Supply
& Demand 178
12 South Korea: Plastics Processing Machinery Demand
by Product & Primary Application 180
13 Indonesia: Plastics Processing Machinery Supply & Demand 183
14 Indonesia: Plastics Processing Machinery Demand
by Product & Primary Application 185
15 Taiwan: Plastics Processing Machinery Supply & Demand 188
16 Taiwan: Plastics Processing Machinery Demand by Product
& Primary Application 190
17 Malaysia: Plastics Processing Machinery Supply & Demand 193
18 Malaysia: Plastics Processing Machinery Demand by Product
& Primary Application 195
19 Vietnam: Plastics Processing Machinery Supply & Demand 198
20 Vietnam: Plastics Processing Machinery Demand by Product
& Primary Application 200
21 Other Asia/Pacific: Plastics Processing Machinery Supply
& Demand 203
22 Other Asia/Pacific: Plastics Processing Machinery Demand
by Product & Primary Application 205
23 Other Asia/Pacific: Plastics Processing Machinery Supply
& Demand by Country 206
SECTION VII — OTHER REGIONS 1 Central & South America: Plastics Processing Machinery
Supply & Demand 210
2 Central & South America: Plastics Processing Machinery
Demand by Product & Primary Application 212
3 Brazil: Plastics Processing Machinery Supply & Demand 215
4 Brazil: Plastics Processing Machinery Demand by Product
& Primary Application 217
5 Other Central & South America: Plastics Processing
Machinery Supply & Demand 220
6 Other Central & South America: Plastics Processing
Machinery Demand by Product & Primary Application 222
7 Eastern Europe: Plastics Processing Machinery Supply
& Demand 225
8 Eastern Europe: Plastics Processing Machinery Demand
by Product & Primary Application 227
9 Russia: Plastics Processing Machinery Supply & Demand 230
10 Russia: Plastics Processing Machinery Demand by Product
& Primary Application 232
11 Poland: Plastics Processing Machinery Supply & Demand 235
12 Poland: Plastics Processing Machinery Demand by Product
& Primary Application 237
13 Czech Republic: Plastics Processing Machinery
Supply & Demand 240
14 Czech Republic: Plastics Processing Machinery Demand
by Product & Primary Application 242
15 Other Eastern Europe: Plastics Processing Machinery Supply
& Demand 245
16 Other Eastern Europe: Plastics Processing Machinery
Demand by Product & Primary Application 247
17 Africa/Mideast: Plastics Processing Machinery Supply
& Demand 250
18 Africa/Mideast: Plastics Processing Machinery Demand
by Product & Primary Application 252
19 Turkey: Plastics Processing Machinery Supply & Demand 255
20 Turkey: Plastics Processing Machinery Demand by Product
& Primary Application 257
21 Iran: Plastics Processing Machinery Supply & Demand 260
22 Iran: Plastics Processing Machinery Demand by Product
& Primary Application 262
23 Other Africa/Mideast: Plastics Processing Machinery Supply
& Demand 265
24 Other Africa/Mideast: Plastics Processing Machinery
Demand by Product & Primary Application 267
25 Other Africa/Mideast: Plastics Processing Machinery Supply
& Demand by Country 268
SECTION VIII — INDUSTRY STRUCTURE 1 Plastics Processing Machinery Sales by Company, 2010 274
2 Selected Cooperative Agreements 286
3 Selected Acquisitions & Divestitures 292
LIST OF CHARTS SECTION II — MARKET ENVIRONMENT 1 World Plastic Resin Demand by Region, 2010 27
2 World Plastics Processing Machinery Pricing, 2000-2020 29
SECTION III — OVERVIEW
1 World Plastics Processing Machinery Demand by Region, 2010 41
2 Plastics Processing Machinery Shipments by Region, 2010 44
3 World Plastics Processing Machinery Demand by Product, 2010 48
4 World Plastics Processing Machinery Demand by Primary
Application, 2010 66
SECTION IV — NORTH AMERICA
1 North America Plastic Processing Machinery Demand
by Country, 2010 78
SECTION V — WESTERN EUROPE
1 Western Europe Plastics Processing Machinery Demand
by Country, 2010 101
SECTION VI — ASIA/PACIFIC
1 Asia/Pacific Plastics Processing Machinery Demand
by Country, 2010 150
SECTION VIII — INDUSTRY STRUCTURE
1 World Plastics Processing Machinery Market Share
by Company, 2010 276
To order this report: Machine Tool and Equipment Industry: World Plastic Processing Machinery Market
Source : www.marketwatch.com


